 Go back


See the steps your company can take towards a more sustainable future through our open resources.


Kite Insights's Climate Report

Introduction *

Commitment And Targets *

Own emissions *

Value chain emissions *
(optional)
Actions and plans to reduce emissions *

Climate Solutions *
(optional)
Management and strategy *
(optional)
Results, challenges and outlook *
Version 1.1.0
Introduction *
reporting year
*2022
number of employees in the reporting year
*38
Commitment And Targets *
net zero target year
*2030
Base year
*2022
comment on your net zero targets
*For the first time, Kite Insights calculated its carbon emissions for the year of 2022. However, our team has found that our data in this area is not as robust as we'd like it to be. In the coming years, we hope to enhance our data collection skills to get a more targeted and accurate information for our reduction plan. As a result of the missing data, our near-term reduction plans may change in the future to reflect updated data. Our intention is to be aligned with SBTi and therefore create an absolute decrease in Scope 1, 2 and 3 carbon emissions of 42% by 2030. In line with that expectation, our short-term goals are to decrease Scopes 1 and 2 by 21% by 2026. We hope to add a short-term goal in Scope 3 very soon.
near-term scope 1 target
*-21
target year
*2026
near-term scope 2 target
*-21
target year
*2026
comment on your near-term targets
*We have ambitions to align our emissions reduction in line with Science-Based Targets. In order to do so, we would have to achieve a 42% reduction in Scope 1, 2 and 3 emissions by 2030. This means an average of a 5.3% absolute emissions reduction per year until 2030. In the near term, that means we hope to achieve a 21% absolute decrease in emissions by the year 2026. Although SBTi does not require SMEs to set near-term targets in Scope 3, we hope to do so in the future once we are more confident in our data.
Own emissions *
scope 1 emissions
scope 1 emissions (metric tons co2e)
*0.0
own facilities
*N/A
own vehicles
*N/A
own processes
*N/A
scope 2 emissions
scope 2 emissions (metric tons co2e)
*15.49
purchased electricity
*0.73
metric tons CO2eRenewable electricity (%)
-
purchased steam
*N/A
Renewable electricity (%)
-
purchased heating
*14.76
metric tons CO2eRenewable electricity (%)
-
purchased cooling
*N/A
Renewable electricity (%)
-
Comment on your energy consumption
*Our energy consumption is based on accounting data and emissions factors rather than actual output. This is what we are hoping to change in the future to get a better read on our usage.
Value chain emissions (optional) *
scope 3 emissions
scope 3 emissions (metric tons co2e)
*785.02
supply chain related - upstream emissions
purchased goods and services
*658.53
metric tons CO2ecapital goods
*N/A
fuel and energy related activities
*N/A
transportation and distribution (upstream)
*N/A
waste in operations
*0.98
metric tons CO2ebusiness travel
*114.52
metric tons CO2eemployee commuting
*11
metric tons CO2ecustomer related - downstream emissions
transportation and distribution (downstream)
*N/A
processing of sold products
*N/A
use of sold products
*N/A
end-of-life treatment of products
*N/A
leased assets (downstream)
*N/A
franchises
*N/A
investments
*N/A
describe the calculation methodology and comment on accuracy:
*We have used Plan A's platform to assess our carbon footprint. This includes using National Averages and Emissions Factors for some areas where data is missing or absent.
Actions and plans to reduce emissions *
Scope 1 Actions
own facilities
N/A
-
own vehicles
N/A
-
own processes
N/A
-
scope 2 actions
purchased electricity
Yes
We intend to first get a more accurate picture of what these costs may be rather than using National Averages. We will be exploring renewable energy sources with our rental agency.
purchased steam
N/A
-
purchased heating
Yes
We intend to first get a more accurate picture of what these costs may be rather than using National Averages. We will be exploring renewable energy sources with our rental agency.
purchased cooling
N/A
-
scope 3 actions
supply chain related (upstream)
purchased good and services
*Yes
The most surprising piece of information for us from calculating our own emissions was how high our purchased goods and services carbon emissions were. We are trying to understand why our purchased good and services are so high, especially considering a lot of those purchases are freelancers and what that means for us. This is a priority for us in the upcoming year.
capital goods
*N/A
-
fuel and energy related activities
*N/A
-
transportation and distribution (upstream)
*N/A
-
waste in operation
*Yes
For waste, we did have to use a national average. As a result, we want to improve our measurement in this area.
business travel
*Yes
This is an area that we expected to be a large contributor to our carbon emissions. We are intending to create a policy around short distance vs. long distance travel. In addition, we are also considering a policy on "slow travel" for our medium-distance areas (UK, France, Belgium and Netherlands).
employee commuting
*Yes
We do not have a policy in place currently as many members already work from home or commute via public transport. In the short-term, we intend to encourage members to bike into work. In the longer term, we do hope to encourage employees to bike to work and perhaps get involved with Cycle to Work Government Schemes.
upstream leased assets
*N/A
-
customer related (downstream)
transportation and distribution (downstream)
*N/A
-
processing of sold products
*N/A
-
use of sold products
*N/A
-
end-of-life treatment of products
*N/A
-
leased assets (downstream)
*N/A
-
franchises
*N/A
-
investments
*N/A
-
i have asked my suppliers to halve emissions before 2030 and join the un-backed race to zero campaign
*No
i have communicated my commitment and actions to my business customers and asked them to join the un race to zero
*No
Climate Solutions (optional) *
Provide descriptions/names of your climate solutions:
*Our services include the Sustainability Action Readiness Assessment (SARA) which helps companies identify how ready their employees are for sustainability action by measuring employee knowledge, motivation and action on sustainability. We also sell off-the-shelf and bespoke online climate education modules for clients to upskill their workers. Finally, we also support our clients at articulating their messages on critical issues to the world.
Methodology used to assess these as climate solutions:
*While our team considers our services to be supportive of climate transformation, by the SME Climate Hub's definition a "climate solution" requires the product or service to emit 50% less greenhouse gas emissions. At Kite Insights, we believe that people are a key part of the sustainability transformation. However, at this time we do not have the data to prove that measuring employee engagement on climate would cause a 50% reduction in emissions, although we strongly believe it to be correlated. The same goes for measuring whether mandatory employee climate training would cause a 50% reduction in greenhouse gas emissions.
Management and strategy (optional) *
Results, challenges and outlook *
Kite Insights's Climate Report
Kite Insights's Climate Report - 2022
Introduction *
reporting year
*2022
number of employees in the reporting year
*38
Commitment And Targets *
net zero target year
*2030
Base year
*2022
comment on your net zero targets
*For the first time, Kite Insights calculated its carbon emissions for the year of 2022. However, our team has found that our data in this area is not as robust as we'd like it to be. In the coming years, we hope to enhance our data collection skills to get a more targeted and accurate information for our reduction plan. As a result of the missing data, our near-term reduction plans may change in the future to reflect updated data. Our intention is to be aligned with SBTi and therefore create an absolute decrease in Scope 1, 2 and 3 carbon emissions of 42% by 2030. In line with that expectation, our short-term goals are to decrease Scopes 1 and 2 by 21% by 2026. We hope to add a short-term goal in Scope 3 very soon.
near-term scope 1 target
*-21
target year
*2026
near-term scope 2 target
*-21
target year
*2026
comment on your near-term targets
*We have ambitions to align our emissions reduction in line with Science-Based Targets. In order to do so, we would have to achieve a 42% reduction in Scope 1, 2 and 3 emissions by 2030. This means an average of a 5.3% absolute emissions reduction per year until 2030. In the near term, that means we hope to achieve a 21% absolute decrease in emissions by the year 2026. Although SBTi does not require SMEs to set near-term targets in Scope 3, we hope to do so in the future once we are more confident in our data.
Own emissions *
scope 1 emissions
scope 1 emissions (metric tons co2e)
*0.0
own facilities
*N/A
own vehicles
*N/A
own processes
*N/A
scope 2 emissions
scope 2 emissions (metric tons co2e)
*15.49
purchased electricity
*0.73
metric tons CO2eRenewable electricity (%)
-
purchased steam
*N/A
Renewable electricity (%)
-
purchased heating
*14.76
metric tons CO2eRenewable electricity (%)
-
purchased cooling
*N/A
Renewable electricity (%)
-
Comment on your energy consumption
*Our energy consumption is based on accounting data and emissions factors rather than actual output. This is what we are hoping to change in the future to get a better read on our usage.
Value chain emissions (optional) *
scope 3 emissions
scope 3 emissions (metric tons co2e)
*785.02
supply chain related - upstream emissions
purchased goods and services
*658.53
metric tons CO2ecapital goods
*N/A
fuel and energy related activities
*N/A
transportation and distribution (upstream)
*N/A
waste in operations
*0.98
metric tons CO2ebusiness travel
*114.52
metric tons CO2eemployee commuting
*11
metric tons CO2ecustomer related - downstream emissions
transportation and distribution (downstream)
*N/A
processing of sold products
*N/A
use of sold products
*N/A
end-of-life treatment of products
*N/A
leased assets (downstream)
*N/A
franchises
*N/A
investments
*N/A
describe the calculation methodology and comment on accuracy:
*We have used Plan A's platform to assess our carbon footprint. This includes using National Averages and Emissions Factors for some areas where data is missing or absent.
Actions and plans to reduce emissions *
Scope 1 Actions
own facilities
N/A
-
own vehicles
N/A
-
own processes
N/A
-
scope 2 actions
purchased electricity
Yes
We intend to first get a more accurate picture of what these costs may be rather than using National Averages. We will be exploring renewable energy sources with our rental agency.
purchased steam
N/A
-
purchased heating
Yes
We intend to first get a more accurate picture of what these costs may be rather than using National Averages. We will be exploring renewable energy sources with our rental agency.
purchased cooling
N/A
-
scope 3 actions
supply chain related (upstream)
purchased good and services
*Yes
The most surprising piece of information for us from calculating our own emissions was how high our purchased goods and services carbon emissions were. We are trying to understand why our purchased good and services are so high, especially considering a lot of those purchases are freelancers and what that means for us. This is a priority for us in the upcoming year.
capital goods
*N/A
-
fuel and energy related activities
*N/A
-
transportation and distribution (upstream)
*N/A
-
waste in operation
*Yes
For waste, we did have to use a national average. As a result, we want to improve our measurement in this area.
business travel
*Yes
This is an area that we expected to be a large contributor to our carbon emissions. We are intending to create a policy around short distance vs. long distance travel. In addition, we are also considering a policy on "slow travel" for our medium-distance areas (UK, France, Belgium and Netherlands).
employee commuting
*Yes
We do not have a policy in place currently as many members already work from home or commute via public transport. In the short-term, we intend to encourage members to bike into work. In the longer term, we do hope to encourage employees to bike to work and perhaps get involved with Cycle to Work Government Schemes.
upstream leased assets
*N/A
-
customer related (downstream)
transportation and distribution (downstream)
*N/A
-
processing of sold products
*N/A
-
use of sold products
*N/A
-
end-of-life treatment of products
*N/A
-
leased assets (downstream)
*N/A
-
franchises
*N/A
-
investments
*N/A
-
i have asked my suppliers to halve emissions before 2030 and join the un-backed race to zero campaign
*No
i have communicated my commitment and actions to my business customers and asked them to join the un race to zero
*No
Climate Solutions (optional) *
Provide descriptions/names of your climate solutions:
*Our services include the Sustainability Action Readiness Assessment (SARA) which helps companies identify how ready their employees are for sustainability action by measuring employee knowledge, motivation and action on sustainability. We also sell off-the-shelf and bespoke online climate education modules for clients to upskill their workers. Finally, we also support our clients at articulating their messages on critical issues to the world.
Methodology used to assess these as climate solutions:
*While our team considers our services to be supportive of climate transformation, by the SME Climate Hub's definition a "climate solution" requires the product or service to emit 50% less greenhouse gas emissions. At Kite Insights, we believe that people are a key part of the sustainability transformation. However, at this time we do not have the data to prove that measuring employee engagement on climate would cause a 50% reduction in emissions, although we strongly believe it to be correlated. The same goes for measuring whether mandatory employee climate training would cause a 50% reduction in greenhouse gas emissions.
Management and strategy (optional) *
Results, challenges and outlook *
Generating a PDF file. Please wait....
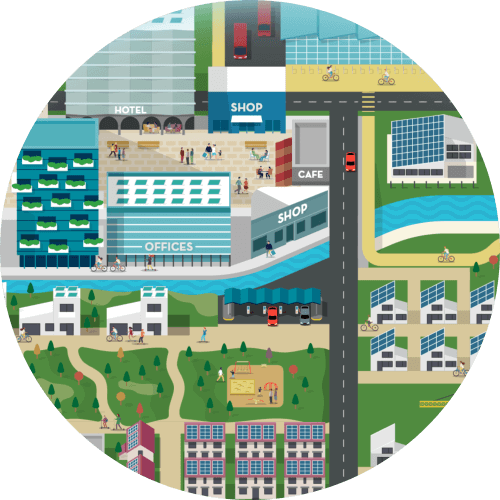
Not sure how to start?
See the steps you can take and get help building a plan to cut your business emissions today.
¿No estás seguro de por dónde empezar?
Revisa los pasos que puedes dar y obtén ayuda para elaborar un plan para reducir las emisiones de tu empresa hoy mismo.
لست متأكداً كيف تبدأ؟
اطلع على الخطوات التي يمكنك اتخاذها واحصل على المساعدة في وضع خطة لخفض انبعاثات شركتك اليوم.
Vous ne savez pas par où commencer ?
Découvrez les mesures que vous pouvez prendre et obtenez de l’aide pour élaborer un plan pour réduire les émissions de votre entreprise dès aujourd’hui.
Ready to commit to lower emissions?
It’s easy to make the commitment. Just complete a form sharing your intent to reduce your emissions.
You’ll earn public recognition for taking the first step.
¿Listo para comprometerte a reducir tus emisiones?
Es fácil comprometerse. Solo tienes que completar un formulario compartiendo tu intención de reducir tus emisiones.
Ganarás reconocimiento público por tomar este primer paso.
هل أنت مستعد للالتزام بتقليل الانبعاثات؟
الالتزام سهل. ما عليك سوى تعبئة نموذج لمشاركة عزمك على تقليل انبعاثاتك.
سوف تحظى باعتراف عام باتخاذك الخطوة الأولى.
Prêt à vous engager pour réduire les émissions ?
S’engager est simple. Il suffit de remplir un formulaire indiquant votre intention de réduire vos émissions.
Vous gagnerez une reconnaissance publique pour avoir fait le premier pas.
Register now to use our tools
Register now to use our tools
Stay updated!
Sign up for our newsletter to stay updated with the latest climate developments.
Log in
Don't have an account? Create account to access our tools or make the SME Climate Commitment
Log in
Don't have an account? Create account to access our tools or make the SME Climate Commitment
Log in
Don't have an account? Create account to access our tools or make the SME Climate Commitment
Forgot password?
Please enter your email address. You will receive a link to create a new password via email.